You can develop your own custom report template with XQual. A custom report consists in an XSLT file.
For more detailed about how the whole report generation works and how to create your own XSLT, please check the How to develop a paper report chapter.
To make the task easier, XQual comes with a tool called XReportDebugger that will help you debugging your custom report.
Hence, rather than going through a complete report generation from XQual, you can simply provide in the tool a source XML, your XSLT and test the transformation.
If there is something wrong in your XSLT, some detailed errors are reported, you can modify your XSLT and try again.
This is much faster than going through a real paper report generation from XQual.
It comes with the XQual Fat client for your OS in the
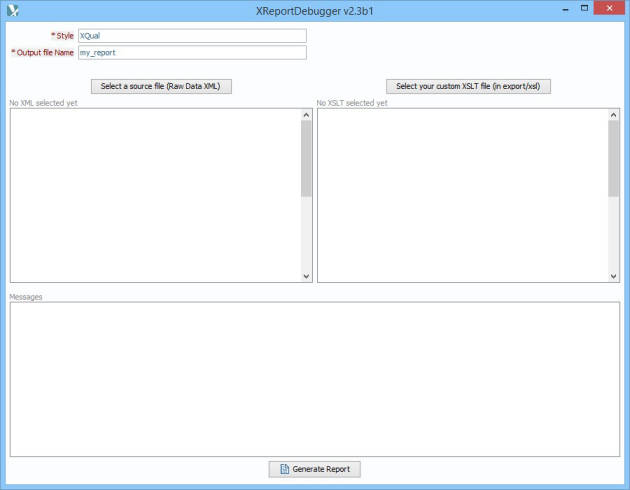
To get a source XML, just start XQual and generate a report similar to the one you are developing and ensure to select (XML) Raw data in the Report type combo box.
You can save this XML file on any location.
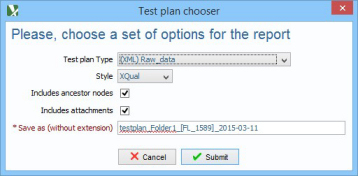
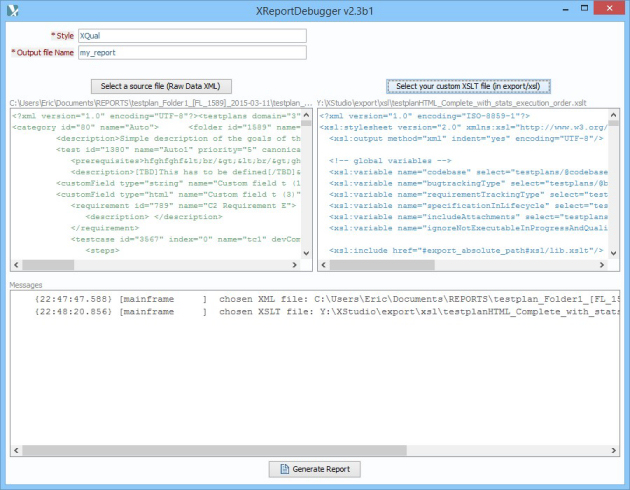
Then, from the XReportDebugger GUI, load this XML in the left pane once for all.
Then, load it on the right pane.
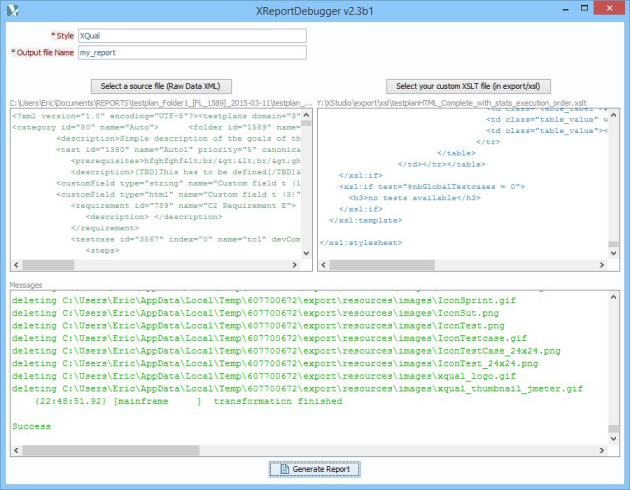
If the transform is successful, the complete log is provided (and colored in green) and the report is automatically opened with the default program (depending its extension).
Conversely, if some problems are detected, the log including the error(s) details are provided (and colored in red) in the message box.
Correct your XSLT and retry!
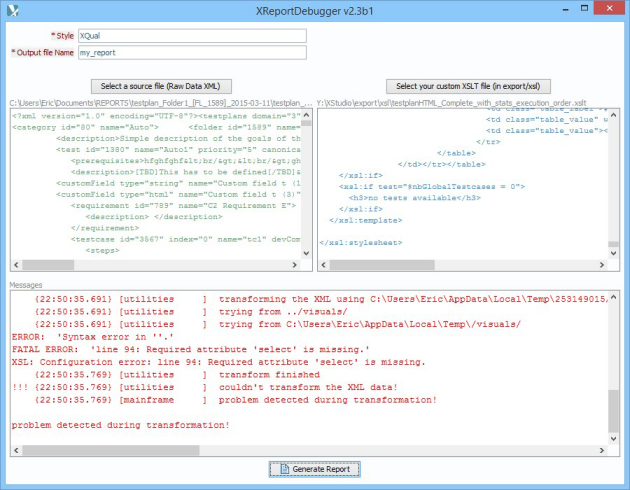
To make the task easier, XQual comes with a tool called XReportDebugger that will help you debugging your custom report.
Goal
XReportDebugger is aimed at being use to debug your custom XSLT files.Hence, rather than going through a complete report generation from XQual, you can simply provide in the tool a source XML, your XSLT and test the transformation.
If there is something wrong in your XSLT, some detailed errors are reported, you can modify your XSLT and try again.
This is much faster than going through a real paper report generation from XQual.
Usage
XReportDebugger is a graphical application so you just need to start it normally.It comes with the XQual Fat client for your OS in the
<Install folder>/bin folder.

Left pane
In the left pane you need to load an example source XML. This is the XML file that is generated first by XQual.To get a source XML, just start XQual and generate a report similar to the one you are developing and ensure to select (XML) Raw data in the Report type combo box.
You can save this XML file on any location.

Then, from the XReportDebugger GUI, load this XML in the left pane once for all.
Right pane
First ensure the XSLT file you're developing is located in the<Install folder>/bin/export/xsl folder.Then, load it on the right pane.

Report generation
Once the XML and the XSLT are loaded, just click on the Generate Report button and the transform will be performed.If the transform is successful, the complete log is provided (and colored in green) and the report is automatically opened with the default program (depending its extension).

Conversely, if some problems are detected, the log including the error(s) details are provided (and colored in red) in the message box.
Correct your XSLT and retry!

IMPORTANT: the XReportDebugger is a nice tool to debug the XSLT transform itself but if you include some javascript code or other similar sections you may need to escape some special characters.
Also, if you need additional resources (i.e. images or javascript code embedded files) this will work only when you provide them as part of the export.zip file on the server.
Also, if you need additional resources (i.e. images or javascript code embedded files) this will work only when you provide them as part of the export.zip file on the server.

