The dashboard
Here is a typical dashboard.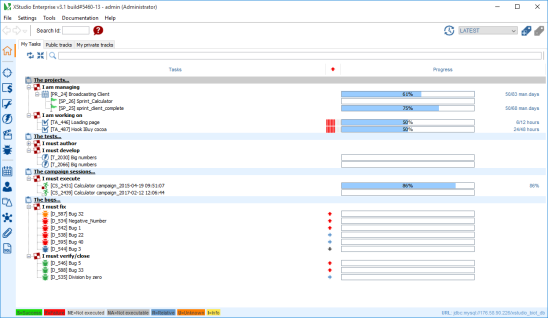
My tasks
All the actions you're assigned to are displayed in the My Tasks tab.Depending on your profile, this may present items as different as:
- the projects you have to manage (if you're a project manager),
- the tasks you are working on,
- the tests you must author (if you're a test writer),
- the tests you must develop (if you're a test developer),
- the campaigns sessions you must execute (if you're a tester),
- the bugs you have to fix (if you're a developer)
- or the bug-fixes you need to verify (if you're a tester).
Projects
Projects you're managing
The screen displays the list of projects you're managing plus some additional information:- the percentage of completion of each project
- the progress in man/days
- the progress of sprints, in each project
To select a project you manage:
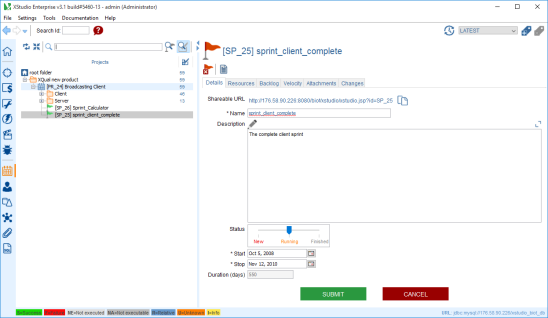
- Click on the project or sprint
- You will be automatically redirected to the selected project or sprint in the projects tree
Projects you're assigned to
The screen displays the list of tasks you're assigned to plus a few additional information:- the priority of each task
- the percentage of progress
- the progress in man/days
To manage the task you must work on:
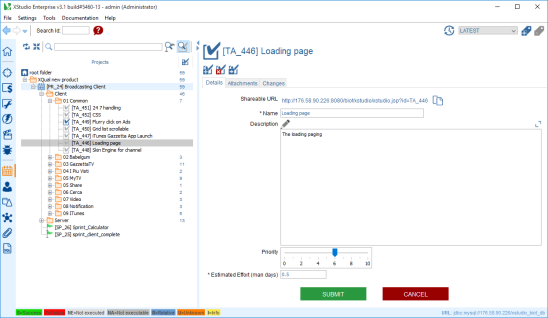
- Click on the task
- You will be redirected automatically to the task in the projects tree
Tests
Tests you must author
The screen displays the list of tests you must author plus some additional information:- the percentage of completion of the test authoring
- the ratio of tests case
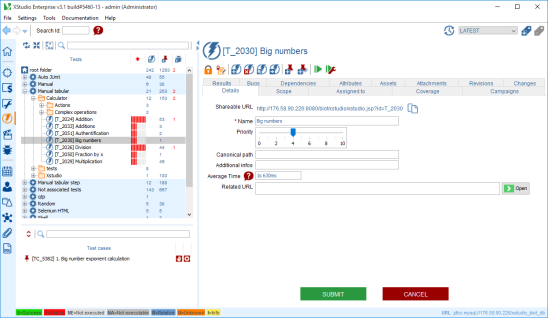
To manage the tests you must author:
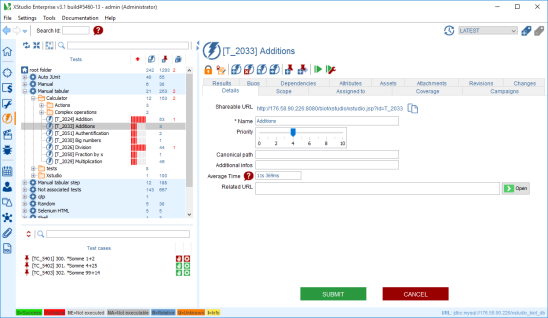
- Click on the test
- You will be automatically redirected to the test in the tests tree
Tests you must develop
The screen displays the list of tests you must develop plus some additional information:- the percentage of completion of the test development
- the ratio of tests case
To manage the test to be developed:
- Click on the test
- You will be automatically redirected to the test in the tests tree
Campaigns sessions
Campaigns sessions you must execute
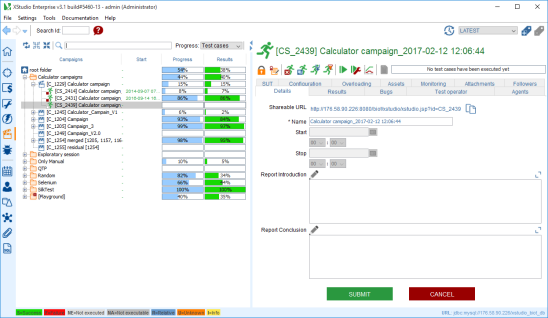
The screen displays the list of campaigns session you must execute and percentage of completion for each campaign:To run your campaign sessions:
- Click on the session
- You will be automatically redirected to the campaigns sessions in the campaign tree
Exploratory sessions
Exploratory sessions you are assigned to
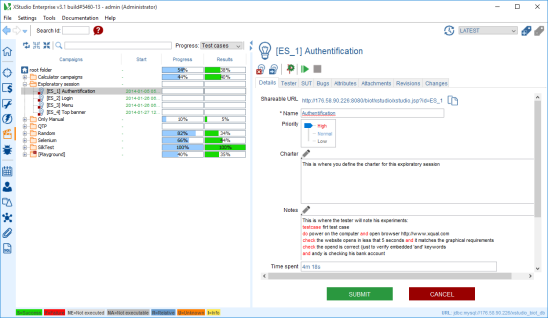
The screen displays the list of exploratory sessions you are assigned to :To manage them:
- Click on the exploratory session
- You will be redirected automatically to the exploratory session in the exploratory sessions tree
Bugs
Bugs you must fix
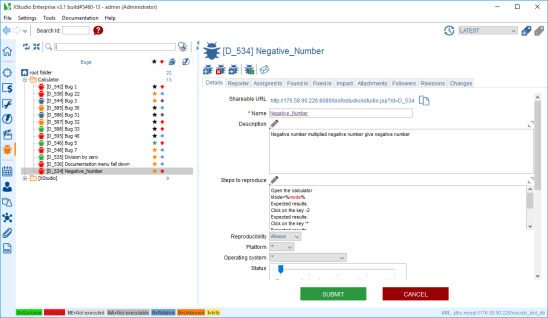
The screen displays the list of bugs you must fix and the percentage of completion of each bug:To manage the bugs you must fix:
- Click on the bug
- You will be automatically redirected to the bug in the bugs tree
Bugs you must verify/close
The screen displays the list of bugs you must verify and close and their percentage of completionTo manage the bugs to be verified and closed:
- Click on the bug
- You will be automatically redirected to the bug to be verified and closed in the bugs tree
Public tracks
Here is a typical public tracks.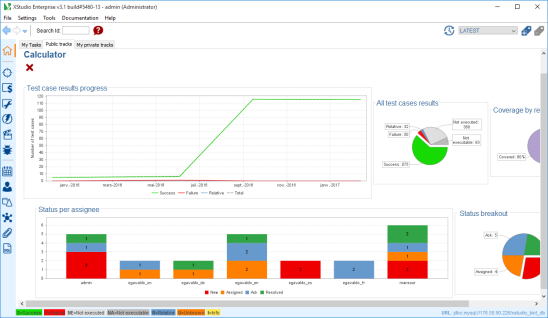
The screens shows all the charts you wish to share with everybody.
You can organize your charts in "Tracks". A track is basically a column with a title and a customized list of charts organized in rows aligned vertically. You can set several charts per row if you wish.
To create a new track, the first step is to click on a button in the tracks toolbar:

You have one button per tree.
- if you wish to include some charts coming from the SUT tree, just click on the button
 ,
, - if you wish to include some charts from a campaign or a session click on the button
 ,
, - etc.
That's it! all the users will get real-time progress on the charts you picked.
Create public track
Here is the process to create a public track:- If you wish to include some charts that you can see in the GUI when you select a particular SUT, click on the create SUT track button
 (the process is similar for other trees)
 - a dialog box including two tabs is displayed:
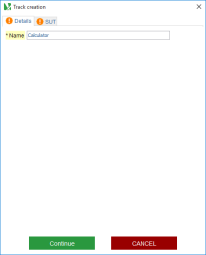
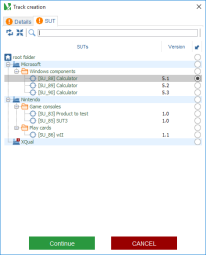
- fill in the Details tab with the name of the track.
- select the SUT tab and pick a SUT you wish to retrieve some charts from
- click on submit
- select some charts on the Charts catalog (on the right panel) and move them to the left using the appropriate button:
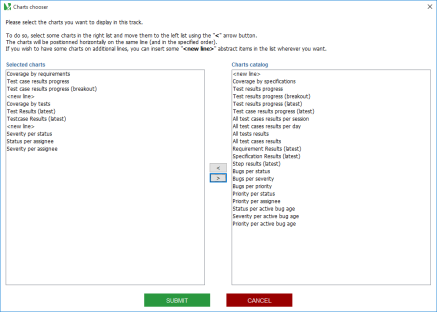
- if you wish to remove some charts from your selection, select some chart in the left panel and move them to the right panel.
- you can insert a new line by moving the <new line> entry to the left. If you do so, the next charts you will include will appear on the following line.
- repeat the operation until you're happy with what you want to share
- click on submit
- the track immediately appears in the panel
Delete public track
Here is the process to delete a public track:- withing the track, just click on the delete track button

- the track is immediately removed from the panel
Move public track
Here is the process to move a public track:- withing the track, just click on the move track to the left button
 or move track to the right button
- the track is immediately moved within the panel
Private tracks
Private tracks provide the exact same functionnalities than public tracks.The only difference is that the tracks will be only visible by you.

